


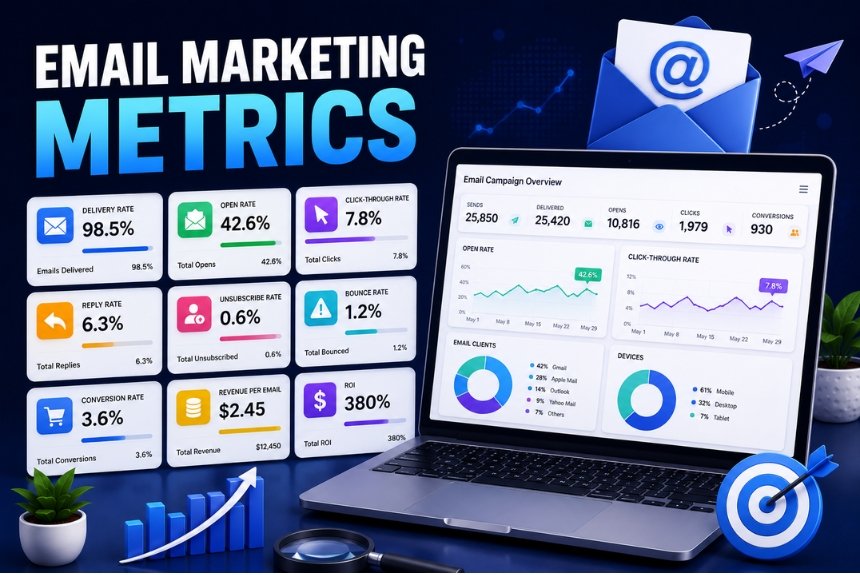
Email Marketing Metrics You Must Track
Email marketing remains one of the highest-performing digital marketing channels, helping businesses build relationships, generate leads, nurture prospects, and drive sales. However, sending campaigns alone is not enough. The real value comes from understanding how your audience interacts with your emails and using that data to improve future campaigns.
This is where email marketing metrics become essential.
Email marketing metrics provide measurable insights into campaign performance. They help marketers understand whether subscribers are opening emails, clicking links, completing desired actions, or disengaging from future communications. By tracking the right metrics, businesses can identify strengths, uncover weaknesses, and make informed decisions that improve engagement and return on investment.
Many marketers focus only on open rates, but a successful email strategy requires monitoring several key performance indicators (KPIs). Metrics such as click-through rate (CTR), conversion rate, bounce rate, unsubscribe rate, spam complaints, and ROI each tell a different part of the story.
In this comprehensive guide, you’ll learn:
- Why email marketing metrics matter
- How to calculate key performance indicators
- Which metrics deserve the most attention
- Common reporting mistakes
- How to build an effective email marketing dashboard
- Best practices for continuous optimization
Whether you’re managing campaigns for a small business, ecommerce store, SaaS company, or digital agency, understanding these metrics will help you make smarter marketing decisions.
Why Email Marketing Metrics Matter
Without measurement, it’s impossible to know whether your email campaigns are achieving their objectives.
Tracking metrics helps businesses:
- Improve campaign performance
- Understand subscriber behavior
- Increase engagement
- Optimize conversion rates
- Protect sender reputation
- Allocate marketing budgets effectively
- Identify opportunities for growth
Instead of relying on assumptions, marketers can use real data to refine subject lines, email content, segmentation, timing, and automation workflows.
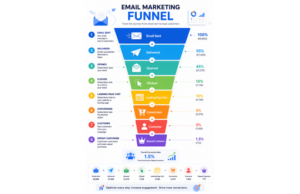
The Email Marketing Funnel
Each metric corresponds to a stage in the customer journey.
| Funnel Stage | Metric |
| Delivery | Bounce Rate |
| Attention | Open Rate |
| Interest | Click-Through Rate |
| Action | Conversion Rate |
| Retention | Unsubscribe Rate |
| Reputation | Spam Complaints |
| Profitability | ROI |
Understanding this funnel helps identify where improvements are needed.
Open Rate
The open rate measures the percentage of delivered emails that recipients open. It is often the first indicator of how effective your subject line, sender name, and timing are.
Formula
Open Rate = (Unique Opens ÷ Delivered Emails) × 100
Example
Delivered Emails: 10,000
Unique Opens: 2,800
Open Rate:
(2,800 ÷ 10,000) × 100 = 28%
Why Open Rate Matters
A healthy open rate suggests that your audience recognizes your brand and finds your emails relevant enough to open.
Factors that influence open rates include:
- Subject line quality
- Sender reputation
- Preview text
- Personalization
- Send time
- Audience segmentation
- List quality
How to Improve Open Rates
Some proven strategies include:
- Write concise, benefit-driven subject lines.
- Personalize subject lines where appropriate.
- Optimize preview text.
- Test different send times.
- Segment your audience.
- Keep your email list clean.
- Avoid spam trigger words.
Remember that open rates are only one piece of the performance puzzle. High opens without clicks or conversions may indicate that the email content isn’t meeting expectations.
Click-Through Rate (CTR)
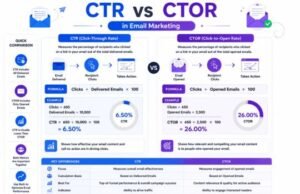
The Click-Through Rate (CTR) measures the percentage of recipients who clicked on at least one link in your email.
Unlike open rate, CTR indicates whether your content and call-to-action successfully encouraged readers to take the next step.
Formula
CTR = (Unique Clicks ÷ Delivered Emails) × 100
Example
Delivered Emails: 10,000
Unique Clicks: 650
CTR:
(650 ÷ 10,000) × 100 = 6.5%
Why CTR Matters
CTR helps answer questions such as:
- Was the content engaging?
- Was the CTA compelling?
- Did readers find the offer valuable?
- Was the email relevant to the audience?
A low CTR despite a high open rate often suggests that improvements are needed in the email body, design, or offer.
Factors That Influence CTR
Several elements affect click-through performance:
Call-to-Action (CTA)
Strong CTAs should be:
- Clear
- Action-oriented
- Visually prominent
- Benefit-focused
Examples:
- Start Your Free Trial
- Download the Guide
- Book Your Demo
- Shop Now
Email Design
Good design improves readability and usability.
Best practices include:
- Mobile-responsive layouts
- Clear headings
- Short paragraphs
- High-contrast CTA buttons
- Logical content hierarchy
Content Relevance
Subscribers are more likely to click when emails match their interests and stage in the customer journey.
Audience segmentation and personalization play a major role in improving CTR.
Click-to-Open Rate (CTOR)
Many marketers also track Click-to-Open Rate (CTOR), which measures the percentage of recipients who clicked after opening the email.
Formula
CTOR = (Unique Clicks ÷ Unique Opens) × 100
This metric isolates the effectiveness of the email content itself, making it useful for evaluating copy, design, and calls-to-action.
Open Rate vs CTR
| Metric | Measures | Main Focus |
| Open Rate | Emails opened | Subject line, sender name, timing |
| CTR | Link clicks | Email content and CTA |
| CTOR | Clicks after opens | Content effectiveness |
Tracking these metrics together provides a more complete understanding of campaign performance.
Best Practices for Higher Engagement
To improve both open rates and CTR:
- Personalize email content.
- Segment your audience.
- Keep messages concise.
- Use one primary CTA.
- Optimize for mobile devices.
- Include relevant visuals where appropriate.
- Test subject lines and CTAs regularly.
Consistent testing and optimization are essential for long-term success.
Conversion Rate
While open rates and click-through rates measure engagement, the conversion rate measures business outcomes. It shows how many recipients completed your desired action after interacting with your email.
For most businesses, this is one of the most valuable email marketing metrics because it directly reflects campaign success.
What is a Conversion?
A conversion depends on your campaign objective.
Examples include:
- Purchasing a product
- Booking a consultation
- Registering for a webinar
- Downloading an eBook
- Starting a free trial
- Filling out a contact form
- Requesting a quote
- Creating an account
Conversion Rate Formula
Conversion Rate = (Conversions ÷ Delivered Emails) × 100
Example
Delivered Emails: 8,000
Conversions: 240
Conversion Rate:
(240 ÷ 8,000) × 100 = 3%
How to Improve Conversion Rate
Increase conversions by:
- Matching email content with landing pages.
- Using one clear call-to-action.
- Optimizing landing page speed.
- Simplifying forms.
- Building trust with testimonials and reviews.
- Personalizing offers.
- Segmenting your audience.
- Running A/B tests on CTAs and landing pages.
Remember, a high CTR with a low conversion rate often indicates problems on the landing page rather than within the email itself.
Bounce Rate
Bounce rate measures the percentage of emails that were not successfully delivered.
Maintaining a low bounce rate helps protect your sender reputation and improves future email deliverability.
Types of Email Bounces
Soft Bounce
A temporary delivery issue.
Common reasons:
- Recipient inbox is full.
- Email server is temporarily unavailable.
- Message size is too large.
Soft bounces may be delivered successfully after another attempt.
Hard Bounce
A permanent delivery failure.
Examples:
- Invalid email address
- Non-existent domain
- Closed mailbox
Hard bounce addresses should generally be removed from your mailing list.
Bounce Rate Formula
Bounce Rate = (Bounced Emails ÷ Emails Sent) × 100
How to Reduce Bounce Rate
Best practices include:
- Verify email addresses at signup.
- Remove inactive subscribers regularly.
- Avoid purchased email lists.
- Use confirmed (double) opt-in when appropriate.
- Monitor sender reputation.
- Clean your email database periodically.
Unsubscribe Rate
The unsubscribe rate measures how many recipients choose to stop receiving your emails.
Although unsubscribes are normal, a sudden increase may indicate issues with your email strategy.
Formula
Unsubscribe Rate = (Unsubscribes ÷ Delivered Emails) × 100
Why Subscribers Unsubscribe
Common reasons include:
- Receiving too many emails
- Irrelevant content
- Repetitive promotions
- Poor personalization
- Misleading subject lines
- Low-value content
How to Reduce Unsubscribes
You can lower unsubscribe rates by:
- Segmenting your audience.
- Delivering valuable content consistently.
- Setting clear expectations during signup.
- Allowing subscribers to manage email preferences.
- Sending emails at an appropriate frequency.
Spam Complaints
Spam complaints occur when recipients mark your email as spam instead of unsubscribing.
Even a small increase in complaints can negatively affect sender reputation and future inbox placement.
Why Spam Complaints Matter
High complaint rates may lead to:
- Lower deliverability
- Emails landing in spam folders
- Reduced engagement
- Damage to your domain reputation
Reduce Spam Complaints
Follow these best practices:
- Send emails only to permission-based subscribers.
- Use recognizable sender names.
- Make unsubscribe links easy to find.
- Avoid deceptive subject lines.
- Deliver valuable and relevant content.
- Maintain a healthy sending frequency.
ROI Measurement
One of the greatest strengths of email marketing is its ability to generate measurable returns.
Tracking Return on Investment (ROI) helps determine whether your campaigns are profitable.
ROI Formula
ROI = ((Revenue – Campaign Cost) ÷ Campaign Cost) × 100
Example
Campaign Revenue: ₹2,50,000
Campaign Cost: ₹50,000
ROI:
((250,000 – 50,000) ÷ 50,000) × 100 = 400%
This means every ₹1 invested generated ₹4 in profit.
Costs to Include
When calculating ROI, consider:
- Email marketing software
- Design costs
- Copywriting
- Advertising
- Team salaries
- Landing page tools
- Marketing automation software
Including all costs provides a more accurate view of campaign profitability.
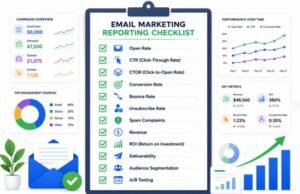
Reporting Dashboard
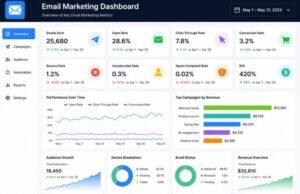
An email marketing dashboard helps marketers monitor performance efficiently by displaying key metrics in one place.
A good dashboard supports informed decision-making and ongoing optimization.
Essential Dashboard Metrics
Track the following KPIs regularly:
- Emails sent
- Delivery rate
- Open rate
- Click-through rate (CTR)
- Click-to-open rate (CTOR)
- Conversion rate
- Bounce rate
- Unsubscribe rate
- Spam complaints
- Revenue
- ROI
Weekly Reporting
Review each campaign to identify trends such as:
- Best-performing subject lines
- Highest-converting email types
- Most effective sending times
- Top-performing audience segments
Monthly Reporting
Analyze long-term performance by tracking:
- Subscriber growth
- Engagement trends
- Revenue generated
- Automation performance
- Customer retention
- Campaign comparisons
These insights support strategic planning and continuous improvement.
Dashboard Best Practices
To create a useful reporting system:
- Focus on actionable metrics.
- Use consistent reporting periods.
- Compare campaigns over time.
- Highlight both successes and opportunities.
- Share insights with relevant team members.
Data is most valuable when it leads to informed action.
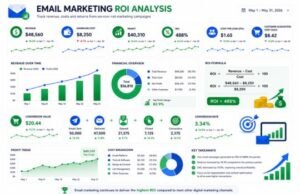
Email Marketing Optimization Cycle
Use the following process to improve campaign performance continuously:
- Plan your campaign.
- Launch the email.
- Measure key metrics.
- Identify weaknesses.
- Run A/B tests.
- Implement improvements.
- Repeat consistently.
This ongoing optimization cycle helps businesses improve engagement and maximize return on investment over time.
Common Email Marketing Metrics Mistakes
Tracking metrics is important, but interpreting them incorrectly can lead to poor marketing decisions. Many businesses focus on a single KPI while ignoring the broader customer journey.
Avoid these common mistakes to get the most value from your email marketing data.
1. Focusing Only on Open Rate
A high open rate looks encouraging, but it doesn’t always translate into business results.
Example:
- Open Rate: 40%
- CTR: 1%
- Conversion Rate: 0.2%
Although many recipients opened the email, very few engaged or converted.
Best Practice: Analyze open rate alongside CTR, conversion rate, and ROI.
2. Ignoring Audience Segmentation
Sending identical emails to every subscriber often reduces engagement.
Segment subscribers based on:
- Purchase history
- Interests
- Customer lifecycle stage
- Geographic location
- Previous email engagement
Relevant content typically performs better than generic campaigns.
3. Forgetting Mobile Users
Many subscribers open emails on smartphones.
Always test:
- Mobile responsiveness
- CTA visibility
- Font size
- Image loading
- Form usability
A poor mobile experience can negatively impact clicks and conversions.
4. Not Cleaning Your Email List
Inactive subscribers affect deliverability and distort campaign metrics.
Maintain a healthy list by:
- Removing invalid addresses
- Re-engaging inactive contacts
- Suppressing consistently unresponsive subscribers
5. Ignoring A/B Testing
Without testing, optimization becomes guesswork.
Regularly test:
- Subject lines
- Preview text
- Sender names
- CTA buttons
- Email layouts
- Send times
Small improvements can significantly impact long-term performance.
6. Measuring Too Many Metrics
Tracking every available metric can make reporting difficult.
Instead, focus on KPIs that align with your business goals.
Examples:
- Lead generation → Conversion rate
- Brand awareness → Open rate
- Ecommerce → Revenue and ROI
- Customer retention → Engagement and repeat purchases
Frequently Asked Questions (FAQs)
1. What are email marketing metrics?
Email marketing metrics are measurable indicators that help evaluate campaign performance, subscriber engagement, deliverability, and business outcomes.
2. Which email marketing metric is most important?
There isn’t a single most important metric. The right KPI depends on your campaign objective. For example, awareness campaigns may prioritize open rate, while sales campaigns often focus on conversion rate and ROI.
3. What is the difference between CTR and CTOR?
- CTR (Click-Through Rate): Measures clicks based on delivered emails.
- CTOR (Click-to-Open Rate): Measures clicks based on emails that were opened.
CTOR provides insight into how effective your email content is after recipients open the message.
4. How often should I review email metrics?
Campaign-level metrics should be reviewed after each send, while broader trends should be analyzed weekly and monthly.
5. What causes a high bounce rate?
Common causes include:
- Invalid email addresses
- Outdated contact lists
- Temporary server issues
- Poor list hygiene
6. Why do subscribers unsubscribe?
Subscribers may leave because of excessive email frequency, irrelevant content, poor personalization, or changing interests.
7. How can I improve email ROI?
Increase ROI by:
- Improving audience segmentation
- Personalizing campaigns
- Optimizing landing pages
- Running A/B tests
- Automating follow-ups
- Monitoring conversions
8. Does personalization improve performance?
Yes. Personalized emails often generate stronger engagement because they are more relevant to each subscriber’s interests and behavior.
9. Can automation improve email metrics?
Absolutely. Marketing automation helps deliver timely, relevant messages based on user behavior, which can improve engagement and conversions.
10. Which dashboard metrics should I monitor every week?
A practical weekly dashboard should include:
- Open Rate
- CTR
- CTOR
- Conversion Rate
- Bounce Rate
- Unsubscribe Rate
- Spam Complaints
- Revenue
- ROI
Final Email Marketing Metrics Checklist
Before evaluating your next campaign, review this checklist.
Campaign Setup
- Define campaign goals.
- Identify target audience.
- Segment subscribers.
- Personalize content.
- Optimize subject lines.
Delivery
- Verify sender information.
- Test email rendering.
- Monitor delivery rate.
- Review bounce rate.
Engagement
- Track open rate.
- Measure CTR.
- Analyze CTOR.
- Review heatmaps (if available).
Conversion
- Measure completed actions.
- Track landing page performance.
- Review sales generated.
- Calculate ROI.
Optimization
- Run A/B tests.
- Clean your email list.
- Update audience segments.
- Improve automation workflows.
- Compare campaign performance over time.
Expert Tips for Better Email Marketing Reporting
To build a data-driven email strategy:
- Focus on metrics that support your business objectives.
- Create a consistent reporting schedule.
- Combine engagement metrics with revenue metrics.
- Monitor trends instead of isolated campaign results.
- Use dashboards to visualize performance.
- Document testing results and apply successful changes.
- Continuously refine campaigns based on real subscriber behavior.
Final Recommendation
Tracking email marketing metrics is not just about collecting numbers—it’s about understanding how subscribers interact with your campaigns and using those insights to make better decisions.
Rather than concentrating on a single KPI, build a balanced reporting framework that includes engagement, deliverability, conversions, and financial performance. This holistic approach provides a clearer picture of what’s working and where improvements are needed.
Businesses that regularly analyze, test, and optimize their email campaigns are better positioned to improve customer engagement, increase conversions, and maximize return on investment over time.
Ready to improve your email marketing performance?
Start by selecting a few key metrics that align with your business goals, such as open rate, click-through rate, conversion rate, and ROI. Review these metrics after every campaign, test one improvement at a time, and use the results to guide future decisions.
Consistent measurement and optimization can transform email marketing into one of your most effective digital marketing channels.
Conclusion
Email marketing metrics provide the insights needed to move beyond guesswork and build campaigns that deliver measurable results. By monitoring engagement, deliverability, conversions, and return on investment, businesses can identify opportunities, optimize performance, and create more meaningful customer experiences.
The most successful marketers don’t simply send more emails—they consistently analyze data, test improvements, and refine their strategies over time. With a structured reporting process and a focus on continuous optimization, email marketing can become one of the most reliable and profitable channels in your digital marketing strategy.
Leave a Reply